UnPlotter |
||
Extract numerical data from PDF figures |
Help & Documentation
Table of Contents
Getting Started
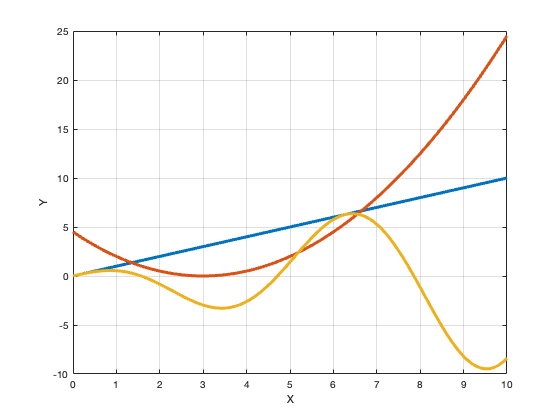
UnPlotter is a browser-based tool that extracts numerical data from vector plots in PDF files. The entire process happens in your browser - your files are never uploaded to any server.
Watch this video for a quick demonstration of UnPlotter in action.
Loading a PDF File
Step 1: Open UnPlotter
Click the "Start UnPlotter" button from the home page or click here.
Step 2: Load Your PDF
- Click the "📁 Load PDF File" button
- Select a PDF file from your computer
- Wait for the PDF to load and render
Once loaded, you'll see the first page of your PDF displayed in the viewer.
Navigation & Viewing
Page Navigation
For multi-page PDFs, use the navigation controls:
- ⇦ Previous - Go to the previous page
- ⇨ Next - Go to the next page
- Page indicator - Shows current page / total pages
Zoom Controls
Adjust the view to see details:
- + - Zoom in (increase size)
- - - Zoom out (decrease size)
- Zoom level - Shows current zoom percentage
Rotation Controls
Rotate the PDF view if needed:
- ↻ - Rotate clockwise (90°)
- ↺ - Rotate counter-clockwise (90°)
Axis Calibration
Calibration converts page coordinates from the PDF into real data values. This is a crucial step before exporting data.
Step 1: Enable Selection Mode
Click the "Enable Selection" button in the side panel. This reveals the calibration section.
Step 2: Calibrate X-Axis
- Click the "Select" button next to the X axis
- Click on a horizontal line that represents extent of the X-axis (or any horizontal reference line)
- Enter the minimum and maximum values for that line in the X Min and X Max fields
The status indicator will show ✓ when complete.
Step 3: Calibrate Y-Axis
- Click the "Select" button next to the Y axis
- Click on a vertical line that represents extent of the Y-axis (or any vertical reference line)
- Enter the minimum and maximum values for that line in the Y Min and Y Max fields
The status indicator will show ✓ when complete.
Selecting & Labeling Curves
Once selection mode is enabled, you can click on curves in the plot to extract them.
Selecting a Curve
- Make sure "Enable Selection" is active (button should be highlighted)
- Click directly on any curve in the plot
- The selected curve will be highlighted on the canvas
Adding a Label
- After selecting a curve, type a descriptive label in the text field (e.g., "Temperature", "Pressure", "Dataset A")
- Click the "Add" button or press Enter
- The curve is now saved with its label and appears in the curve list
Managing Curves
- View curve list - All labeled curves appear in the "Curves" section
- Highlight curve - Click on a curve in the list to highlight it on the canvas
- Delete curve - Click the ✕ button next to a curve to remove it
- Delete all - Click "Delete All" to remove all labeled curves
Exporting Data
Once you've calibrated the axes and labeled at least one curve, you can export your data.
Export Formats
CSV (Comma-Separated Values)
- Universal format compatible with Excel, Google Sheets, MATLAB, Python, R, and more
- Each curve is exported as three columns (Label, X, Y)
- Perfect for spreadsheet applications and data analysis
JSON (JavaScript Object Notation)
- Structured format ideal for programming and web applications
- Contains metadata including curve labels and point counts
- Easy to parse in JavaScript, Python, and other languages
Exporting Your Data
- Scroll to the "Export Data" section (appears after calibration)
- Preview your data in the preview window
- Click "📄 Download CSV" or "📋 Download JSON"
- The file will be saved to your downloads folder with a timestamp
Tips & Best Practices
Getting the Best Results
- Use vector PDFs - Make sure your PDF contains vector graphics, not scanned images
- Zoom for precision - Zoom in when selecting thin lines or closely-spaced curves
- Calibrate accurately - Use axis lines that span the full data range for best accuracy
- Label descriptively - Use clear, meaningful labels that describe each curve
- Check the preview - Always review the data preview before exporting
- Process one plot at a time - Navigate to the correct page before extracting data
Vector vs. Raster Images
Computer image files are either vector or raster images. Vector images are made up of commands to draw lines and curves, while raster images are made up of pixels.
UnPlotter only works with vector PDFs. Raster images cannot be processed.
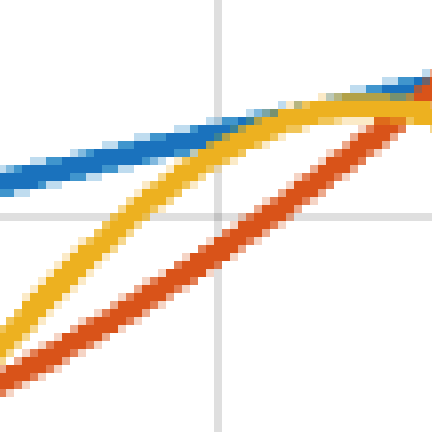
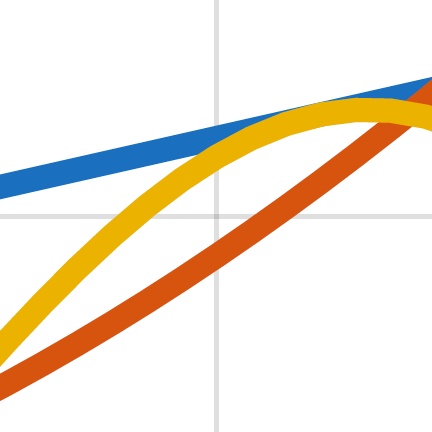
Identifying Whether an Image is a Vector or Raster
The easiest way to tell if an image is a vector or a raster is to zoom in on it.
If it is a raster image, it will appear pixelated and blurry when zoomed in, like the image on the left. If it is a vector image, it will appear smooth and sharp when zoomed in, like the image on the right.
Digitizing Raster Images
Q: My Image is a Raster Image, What Should I do?
A: Use Plot Digitizer or WebPlotDigitizer.
There have been many other programs for extracting data from raster images over the years. Plot Digitizer and WebPlotDigitizer appear to be actively developed.
Troubleshooting
No curves appear when I click
Possible causes:
- Selection mode is not enabled - click "Enable Selection" first
- The PDF contains raster images, not vector paths
- You're clicking between curves instead of directly on them
Solution: Try zooming in and clicking directly on the curve line. If still not working, your PDF may not contain extractable vector data.
Calibration not working
Possible causes:
- You haven't entered min/max values after selecting the line
- The selected line isn't perfectly horizontal (X-axis) or vertical (Y-axis)
Solution: Make sure to fill in both min and max values for each axis. Select lines that are as straight as possible.
Exported data looks wrong
Possible causes:
- Calibration values were entered incorrectly
- Wrong curve was selected
- PDF contains complex overlapping paths
Solution: Reset calibration and try again. Double-check your min/max values match the actual axis values. Preview data before exporting.
Browser performance issues
For very large PDFs:
- Close other browser tabs
- Use a modern browser (Chrome, Firefox, Edge, Safari)
- Process one page at a time
Limitations
UnPlotter is a powerful tool, but it has some limitations:
- Vector graphics only - Cannot extract from scanned images or raster plots
- Linear axes only - Logarithmic or polar scales require manual post-processing
- 2D plots only - 3D plots and surface plots are not supported
- Manual calibration - Axes must be calibrated manually (no automatic detection)
- No image recognition - Cannot recognize or extract data from bitmap images embedded in PDFs
Privacy & Security
Your privacy is important. UnPlotter is designed with privacy in mind:
100% Local Processing
- No uploads - Your PDF files never leave your computer
- No servers - All processing happens in your browser
- No tracking - We don't collect any data about your usage
- No accounts - No registration or login required
How It Works
UnPlotter uses browser-based technologies (PDF.js, Canvas API) to process your files entirely within your web browser. When you load a PDF file:
- The file is read from your local filesystem
- PDF.js parses the file in browser memory
- Vector paths are extracted and displayed on a Canvas element
- Exported data is generated and downloaded directly
At no point is any data transmitted over the internet (except for initially loading the UnPlotter application itself).
Open Source
UnPlotter is open source software. You can:
- View the complete source code on GitHub
- Run it locally on your own computer
- Modify it for your own needs
Free
UnPlotter is totally free:
- There is no cost to use UnPlotter
- There is no advertising
- There is no tracking of users
Support UnPlotter!
If you find UnPlotter useful, please consider some support:
Need More Help?
If you're still having trouble or have questions:
- GitHub Issues - Report bugs or request features at github.com/ramcdona/unplotter/issues
- Source Code - Explore the code at github.com/ramcdona/unplotter